In this example we are going to execute the following script and create a log of it’s execution:
example.R:
#' Setup
library(dplyr)
library(ggplot2)
#' Prepare data
x <- mtcars |>
as_tibble(rownames = "car")
print(x)
#' Create and save plot
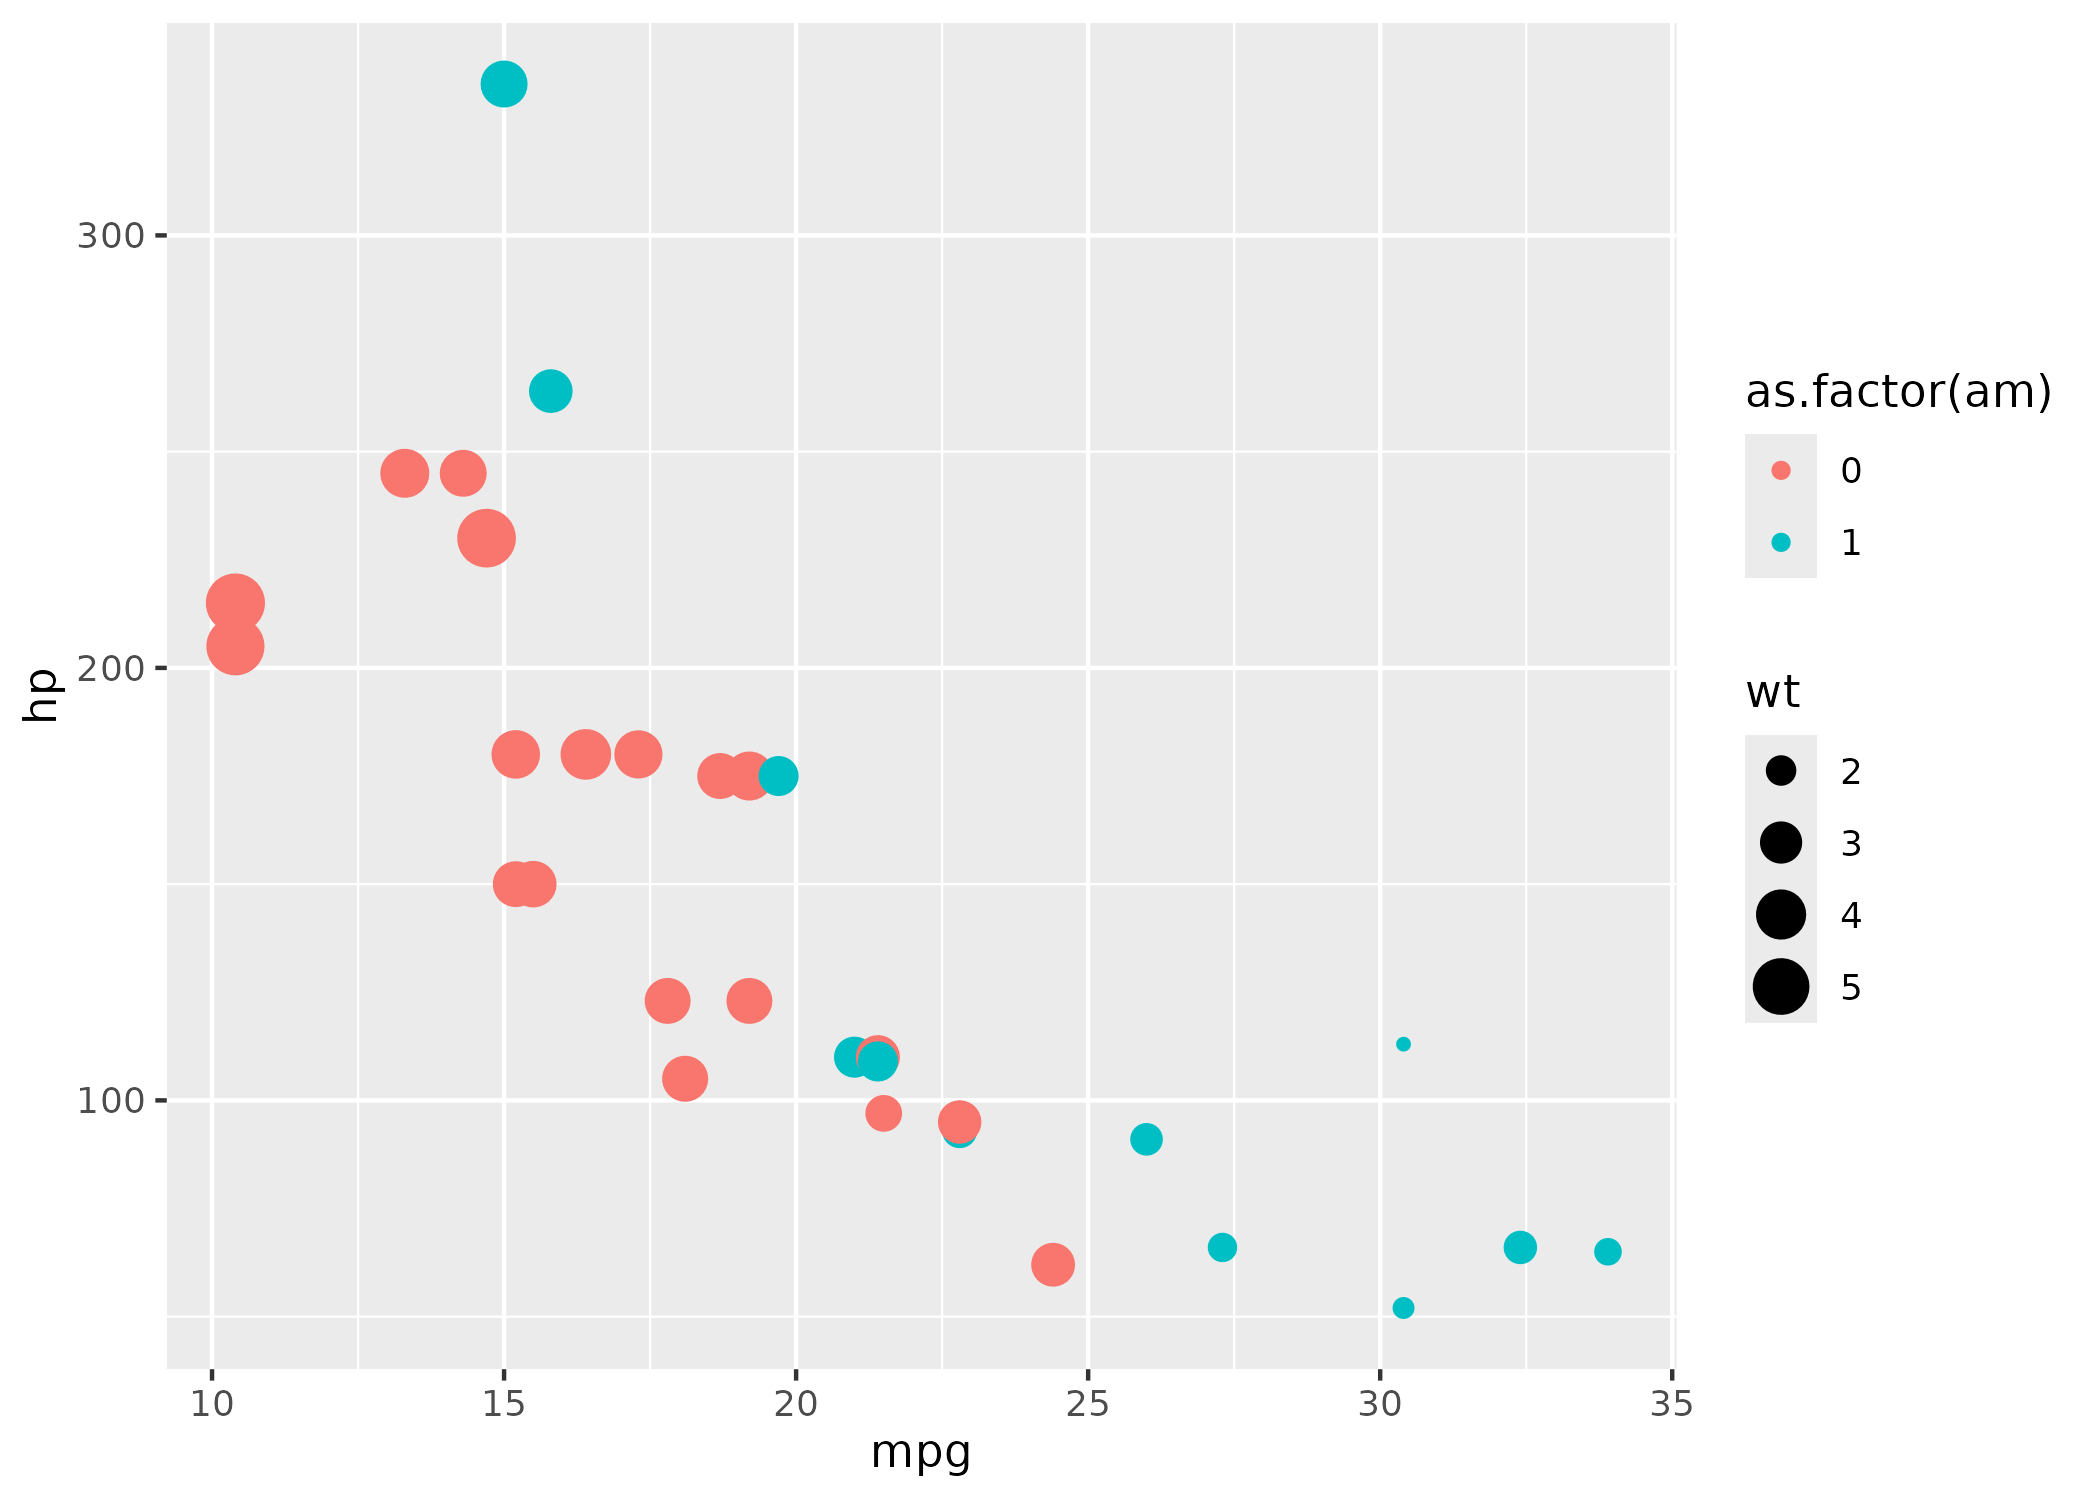
ggplot(data = x) +
geom_point(mapping = aes(x = mpg, y = hp, size = wt, colour = as.factor(am)))
ggsave("plot1.png")We are going to use the run() function to execute the
script, and since this vignette is created on Linux we can use the
whirl.track_files option to automatically track the used
files:
The verbosity_level is set to minimal for
nicer printing in this vignette. Now we are ready to execute the
script:
result <- run("example.R")
#> ✔ example.R: Completed succesfully. See log html.

print(result)
#> # A tibble: 1 × 6
#>      id tag    script                                status result       log_dir
#>   <dbl> <chr>  <chr>                                 <chr>  <list>       <chr>
#> 1     1 Step 1 /tmp/Rtmps19sd2/file1cac7db0cd05/exa… succe… <named list> /tmp/R…
The script is now executed and you can access the logs below: